Introduction
Your SaaS application is running. Customers can log in, dashboards load, and the main features appear to work.
But is the product actually healthy?
A payment might be taking several seconds to complete. Background jobs could be accumulating in a queue. A third-party API might be responding slowly. An AI feature could be consuming more tokens than expected while delivering inconsistent results. Your application may still appear operational, even when parts of the customer experience are deteriorating.
These problems become harder to investigate as a SaaS product grows. More users, integrations, services, and AI capabilities create more dependencies. A failure in one component can affect several others. This is why observability matters.
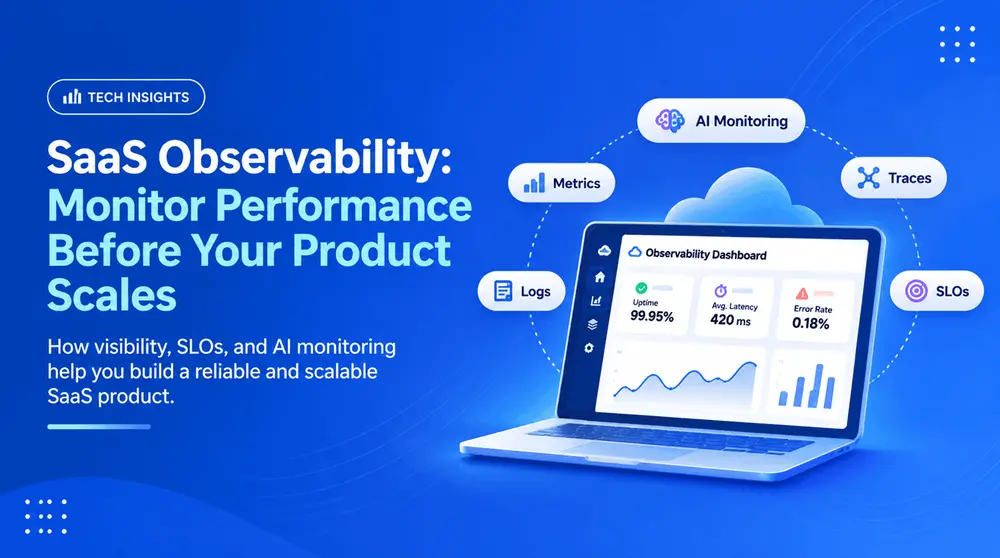
Observability helps engineering teams understand what is happening inside an application, investigate why problems occur, and identify which parts of the system need attention.
For SaaS founders and technology teams, it is not just an infrastructure concern. It is part of building a reliable product without losing control of performance and operating costs.
1. Monitoring Tells You Something Is Wrong. Observability Helps Explain Why.
Monitoring and observability are closely related, but they solve different problems. Monitoring tracks known conditions. For example, you can configure alerts when CPU usage becomes too high, an API starts returning errors, or a server becomes unavailable.
Observability helps investigate problems that may not have been anticipated when those alerts were configured. Consider a simple example.
Your application normally responds to requests within 300 milliseconds. Suddenly, response times increase to 2 seconds. Monitoring can alert your team to the increased latency.
But what caused it?
- A database query may be taking longer.
- An external API might be responding slowly.
- A background process could be consuming resources.
- A recent deployment may have introduced a performance issue.
To investigate these problems, engineering teams typically work with three important telemetry signals:
Logs: Records of application events, errors, requests, and other activities. They help explain what happened at a particular point in time.
Metrics: Numerical measurements such as request latency, error rates, CPU usage, memory consumption, and queue processing time. They help identify patterns and unusual behavior.
Traces: Records that follow an individual request across different services and dependencies. They help identify where delays or failures occur.
When these signals are connected through consistent identifiers and context, engineers can move from an alert to the underlying issue much faster.
2. Why Observability Becomes More Important as SaaS Products Grow
An application serving a small number of users may have relatively few dependencies. As the product evolves, its architecture often becomes more complex. You might introduce:
- Multiple application services and APIs.
- Separate databases and caching systems.
- Payment and authentication integrations.
- Background workers and message queues.
- Cloud storage and third-party services.
- Mobile applications and external clients.
- AI models, agents, and automated workflows.
Each component introduces another place where something can fail or slow down. For example, a customer might successfully submit an order, but the background process responsible for generating the invoice fails. The dashboard still works, but the customer never receives the invoice.
Or a SaaS application might depend on an external payment gateway. If the gateway becomes slow, customers may experience failed or delayed transactions even though the application's own servers are healthy. The challenge is no longer simply checking whether servers are running.
You need visibility into how the different components work together and how their behavior affects actual users.
3. Monitor Customer Journeys, Not Just Servers
One of the biggest mistakes in application monitoring is focusing entirely on infrastructure metrics. CPU usage, memory consumption, server uptime, and database performance are important. But they don't always tell you whether customers can successfully use your product.
Consider a subscription-based SaaS application. Its business-critical workflows might include:
- A new customer registers.
- The customer selects a subscription.
- Payment is processed.
- Account access is activated.
- A confirmation email is sent.
- The customer starts using the product.
A server monitoring dashboard might show that every infrastructure component is healthy. But what if payment succeeds and account activation fails?
From the customer's perspective, the product is broken. This is why observability should include business-critical workflows, not just technical infrastructure. For example, track:
- Successful and failed registrations.
- Payment completion and failure rates.
- Subscription activation delays.
- Background job processing failures.
- API response times for important features.
- Failed integrations and notification delivery.
- Time taken to complete important customer actions.
This connects engineering performance to the actual experience customers receive. It also gives founders and product owners a better understanding of where reliability problems affect the business.
4. Build an Observability Foundation with OpenTelemetry
As a SaaS application grows, teams often end up using different tools for application logs, infrastructure metrics, error tracking, and distributed tracing. This can make troubleshooting difficult, especially when services are built using different technologies. A useful approach is to establish a consistent telemetry foundation.
OpenTelemetry is an open-source framework for generating, collecting, and exporting telemetry data. It supports traces, metrics, logs, and other signals across different programming languages and services.
Rather than locking telemetry collection into one monitoring vendor, teams can use standardized instrumentation and send the data to compatible observability platforms. A practical implementation can include:
- Instrumenting application APIs and important operations.
- Collecting structured application logs.
- Recording request latency and error rates.
- Connecting traces across services and database calls.
- Adding consistent identifiers to related events.
- Collecting infrastructure and background-worker metrics.
- Exporting telemetry through an OpenTelemetry Collector where appropriate.
For example, if a customer reports that an order was delayed, engineers should be able to follow the request through the application, database, payment integration, and background processing system. They shouldn't need to investigate five unrelated dashboards without knowing whether the data is connected.
OpenTelemetry's semantic conventions help teams use consistent names and attributes for telemetry across different services and technologies.
Want us to build this for you?
Infynno builds AI-powered software for EdTech, enterprise, and SaaS teams. Free discovery call · NDA first.
5. AI Features Need Their Own Observability Strategy
This is an important consideration for modern SaaS products. Many applications now include AI-powered features such as document processing, AI assistants, content generation, recommendations, automated workflows, and autonomous agents.
But an AI feature introduces dependencies that traditional application monitoring doesn't fully explain. Consider an AI-powered support assistant.
A single customer request might involve:
- Receiving the customer's question.
- Retrieving relevant information from a knowledge base.
- Sending context to an AI model.
- Receiving a generated response.
- Calling an external tool or business API.
- Validating and returning the final result.
If the assistant takes 30 seconds to respond, where did the delay occur? Was the retrieval system slow? Did the model take longer than expected? Did an agent call the same tool repeatedly? Did a third-party API fail?
Without AI-specific observability, these issues can be difficult to diagnose. For AI-powered applications, teams should consider monitoring:
- Model latency: How long does each model request take? For streaming responses, how long does it take to receive the first token?
- Token consumption: How many input and output tokens are being used? Which features or workflows consume the most?
- AI service costs: What does each AI-powered operation cost, and how does that cost change as usage increases?
- Tool calls and retries: Are AI agents calling tools successfully? Are they retrying unnecessarily or entering repeated execution cycles?
- Workflow failures: Are retrieval, model calls, external integrations, or final response generation failing?
- Output quality: Are responses accurate, relevant, and consistent with the intended task? Are evaluation results deteriorating after a prompt, model, or application change?
For example, a customer support assistant might be technically available but regularly provide incomplete answers. Standard uptime monitoring would not identify this as a quality problem. You need application-level evaluations and appropriate quality checks alongside technical telemetry.
Also, be careful about what you collect. Prompts, responses, customer documents, and tool arguments may contain personal or confidential information. Sensitive content should not be captured indiscriminately in logs or traces. Use appropriate redaction, access controls, and retention policies.
AI observability is not simply another dashboard. It helps teams understand the reliability, performance, cost, and quality of AI-powered features.
6. Define Reliability Targets Instead of Monitoring Everything
Having hundreds of metrics doesn't automatically make an application reliable. Engineering teams need to know which measurements actually matter to users. This is where Service Level Indicators (SLIs) and Service Level Objectives (SLOs) become useful.
An SLI is a measurement of a service's behavior. An SLO is the target the team wants that measurement to meet.
For example:
| Measurement | Example target |
|---|---|
| Successful API requests | 99.9% |
| Important dashboard requests | 95% complete within 500 ms |
| Payment processing | 99.5% successful, excluding provider-side failures |
| Background job completion | 99% processed within the expected time |
These are illustrative targets, not universal standards. Actual targets should reflect the product's requirements, customer expectations, and technical constraints. Teams can also use an error budget: the amount of failure they can tolerate while still meeting their reliability objective.
For example, if a service has a 99.9% availability objective, its error budget represents the remaining 0.1%. If the product repeatedly consumes that budget, the team may need to prioritize reliability work over new feature releases. This creates a more useful conversation between engineering and business teams:
Are we ready to release another feature, or should we address reliability problems first? Google's SRE guidance explains how SLOs and error budgets can help teams balance product development with service reliability.
7. Control Observability Costs as Your Product Grows
Observability itself can become expensive. As traffic increases, applications generate more logs, metrics, traces, and events. If everything is collected and retained indefinitely, monitoring costs can grow quickly. AI-powered applications introduce another cost consideration: model usage and token consumption.
A practical strategy should consider:
- Collecting the telemetry needed to answer important operational questions.
- Using sampling for high-volume traces where appropriate.
- Setting retention policies based on data importance.
- Avoiding unnecessary high-cardinality metric labels.
- Redacting sensitive data before exporting telemetry.
- Tracking observability infrastructure costs.
- Monitoring AI usage and cost by feature or workflow.
For example, you may want to retain detailed error events and selected traces for longer, while applying shorter retention to high-volume routine events.
The objective is not to collect everything. It is to collect enough useful information to understand system behavior without creating an unnecessary operational expense.
8. When Should You Implement Observability?
You don't need a large enterprise observability setup when launching your first SaaS MVP. But you should establish basic visibility from the beginning. A practical progression could look like this:
- Early-stage SaaS product: Start with application logs, error tracking, essential performance metrics, database monitoring, and alerts for critical failures.
- Growing SaaS product: Introduce distributed tracing, background-job monitoring, third-party dependency visibility, centralized telemetry, and defined reliability objectives.
- Complex or AI-enabled SaaS product: Expand into service-level objectives, telemetry correlation, AI model and agent tracing, token and cost monitoring, output evaluation, and more advanced incident workflows. The right level of observability depends on the product's architecture, usage, risk, and business requirements.
The important thing is to avoid treating reliability as something to address only after customers start experiencing problems.
9. Observability Is Part of Building a Reliable SaaS Business
Building a SaaS product is not just about launching features and attracting customers. It is also about ensuring that the product continues to work as usage, infrastructure, and technical complexity increase.
Observability helps engineering teams understand application behavior, investigate failures, identify performance bottlenecks, and make better infrastructure decisions. For AI-enabled products, it also provides visibility into model performance, token consumption, workflow execution, and output quality.
At Infynno Solutions, we work on custom SaaS applications, cloud infrastructure, application performance, and DevOps engineering. We believe reliability should be considered as part of product architecture and ongoing development, not just an emergency response after something breaks.
Building or scaling a SaaS product?
Let's discuss how to build a reliable application with the right cloud infrastructure, monitoring, and DevOps foundation. Explore Infynno's Cloud and DevOps services.